
Explore our gallery to see how Insight Empire transforms raw data into powerful, insightful visualizations. From interactive Power BI dashboards to dynamic Excel and Google Sheets reports, our custom solutions help businesses uncover trends, optimize performance, and make smarter decisions.
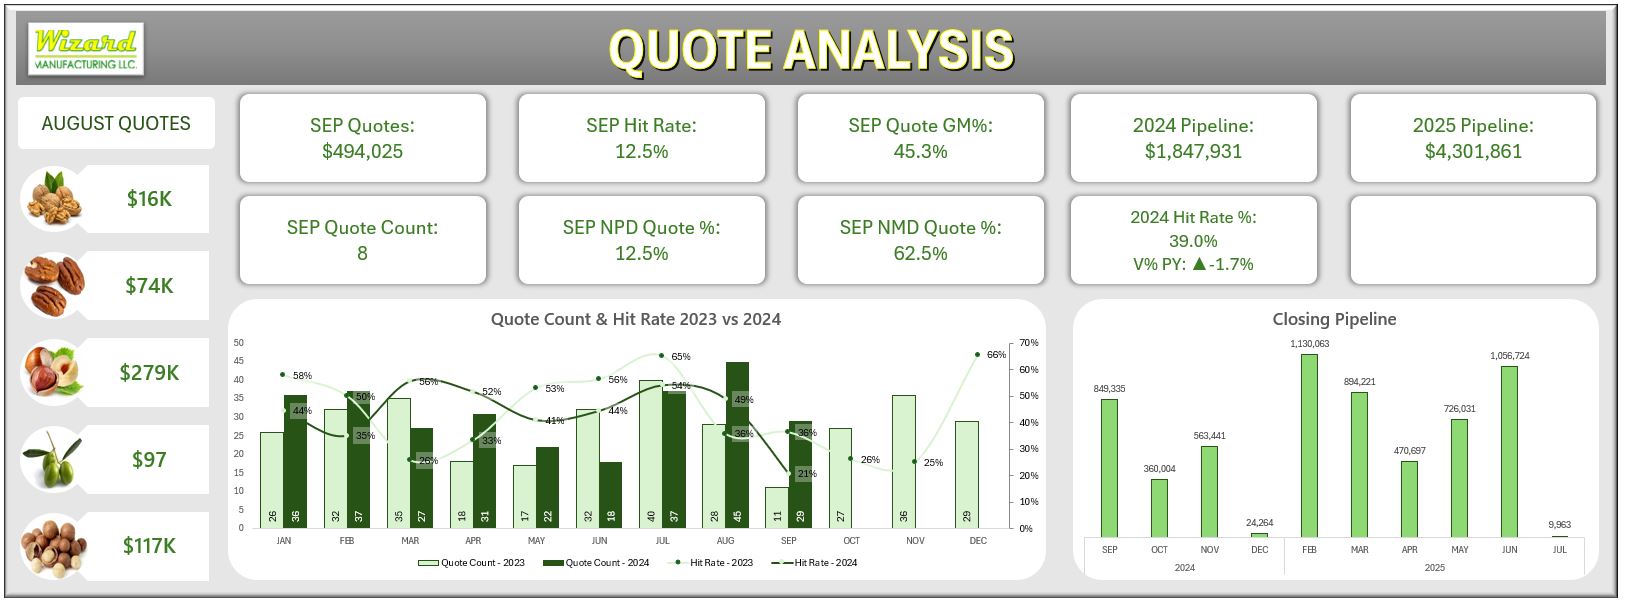
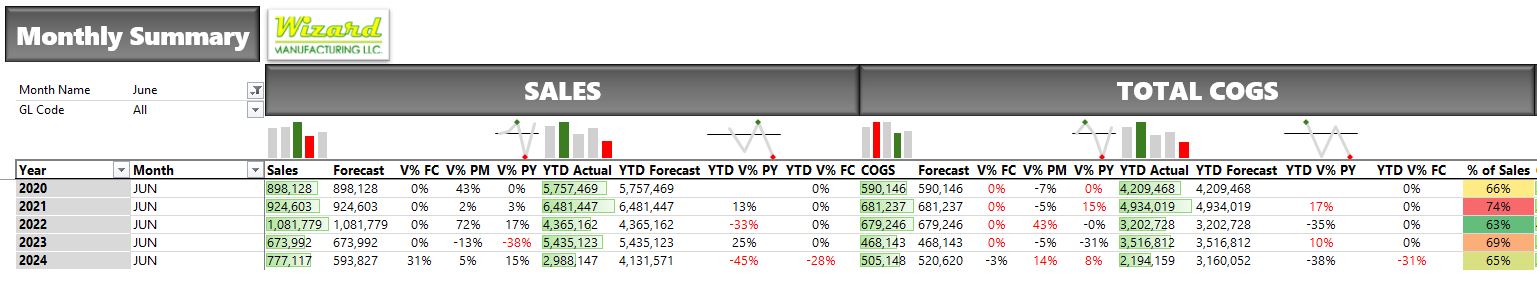
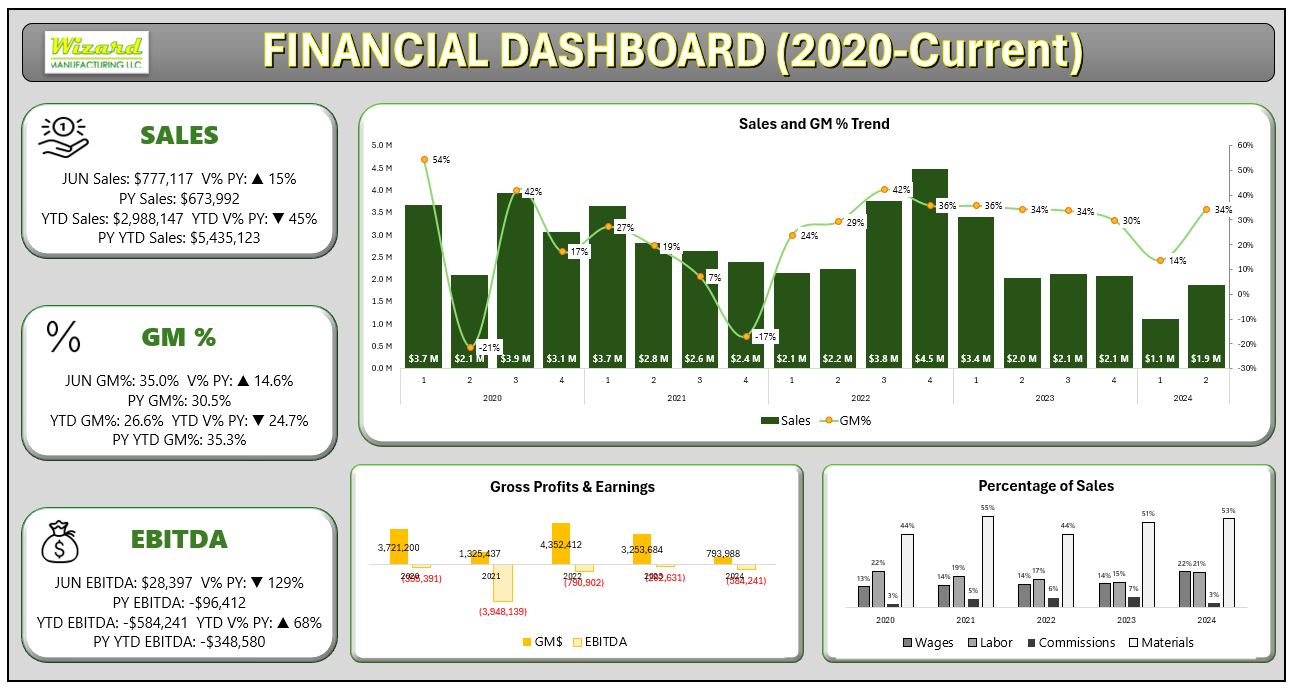
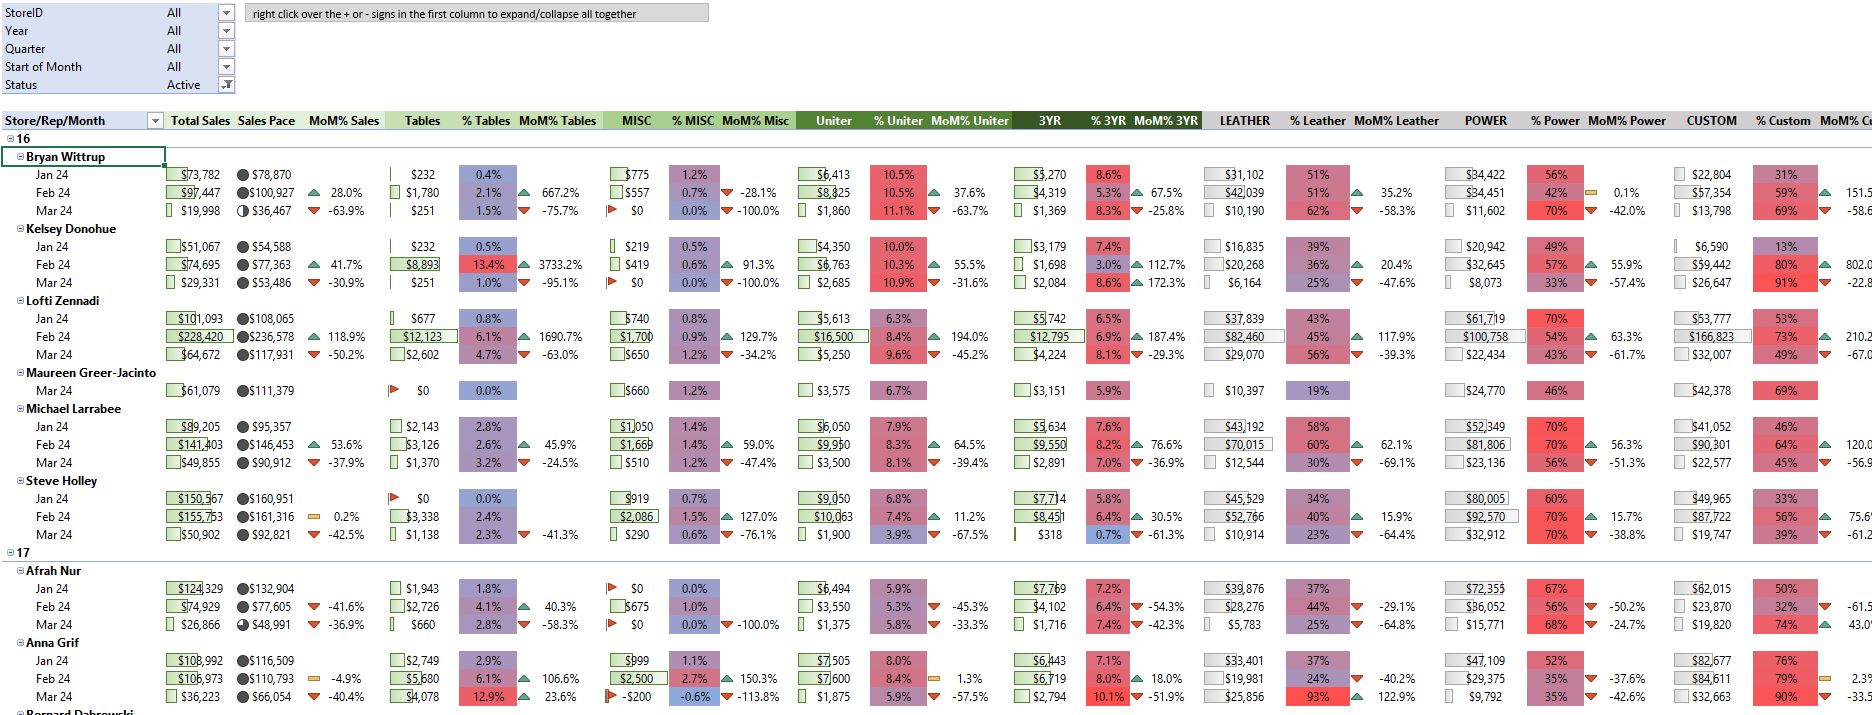
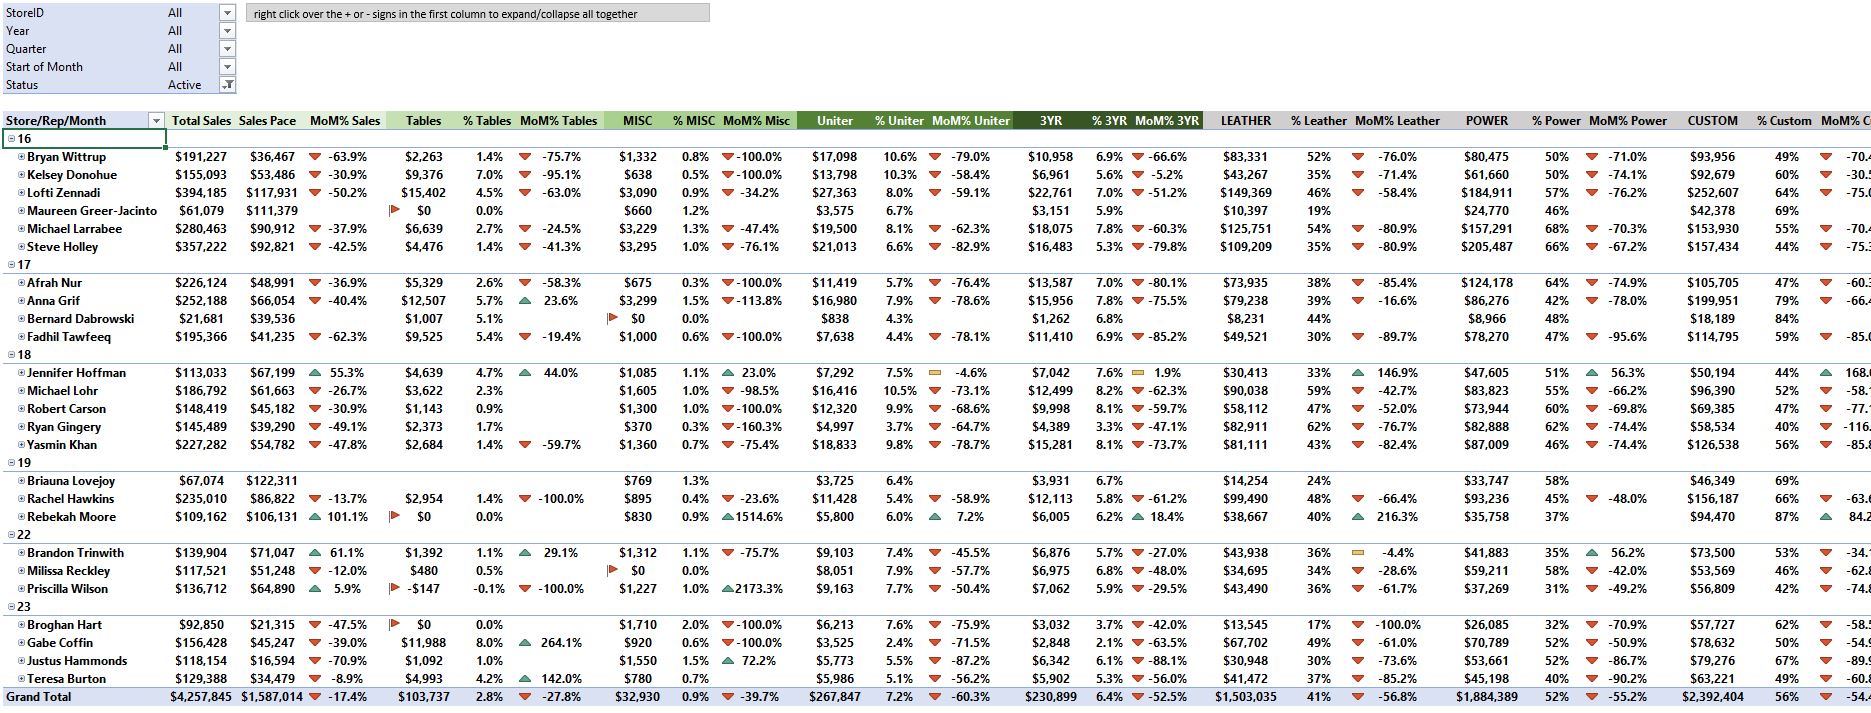
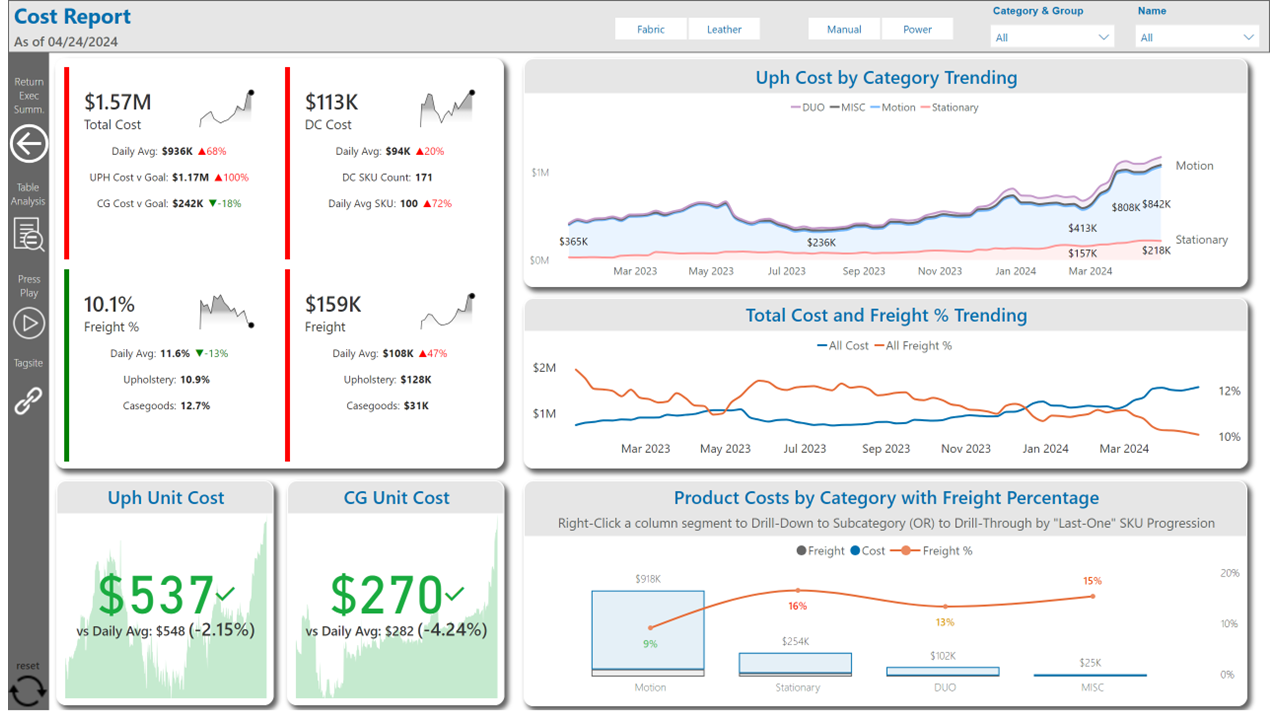
📊 Financial Reports – Clear, concise dashboards for tracking revenue, expenses, and profitability.
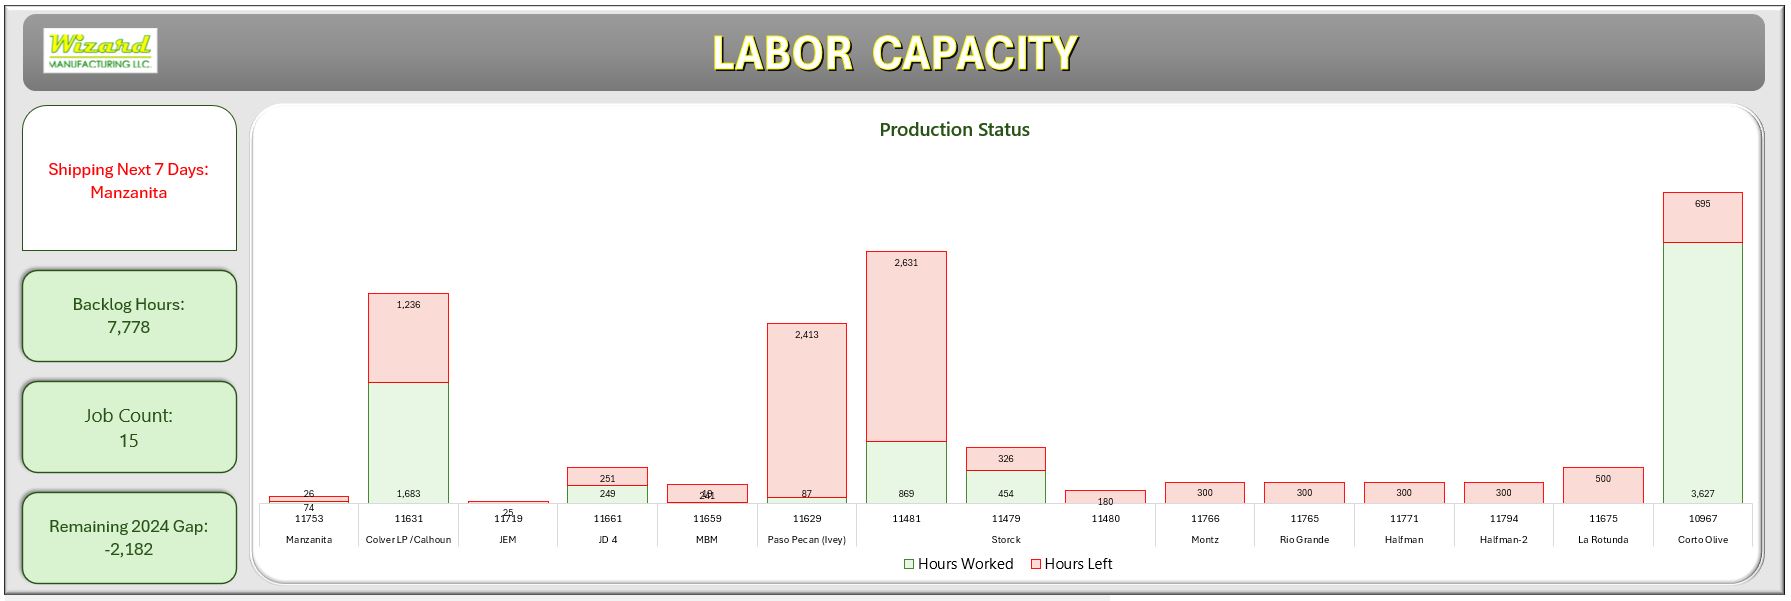
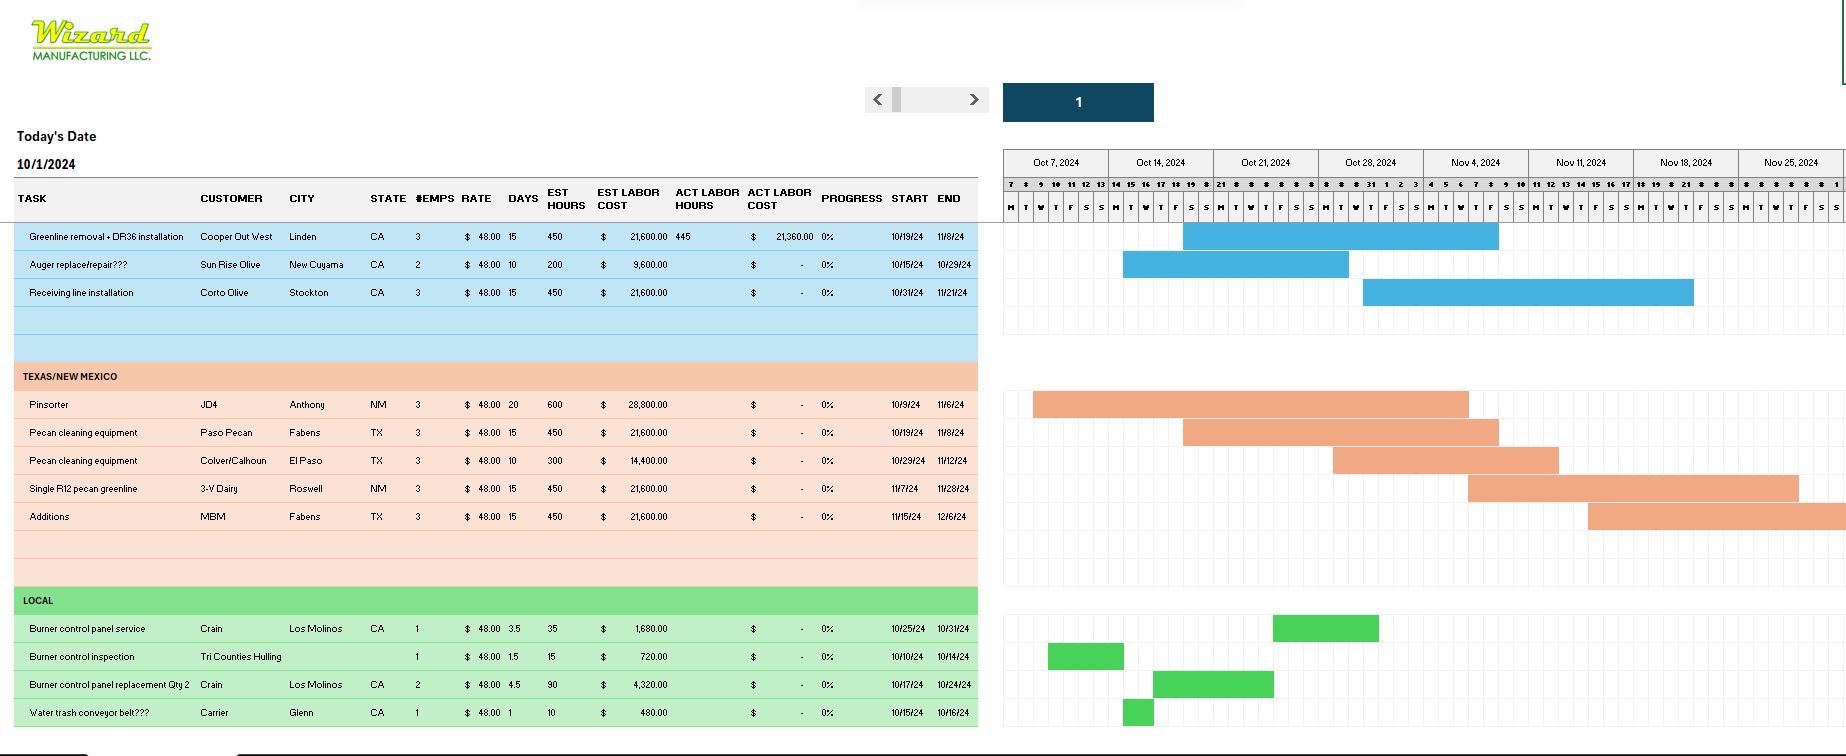
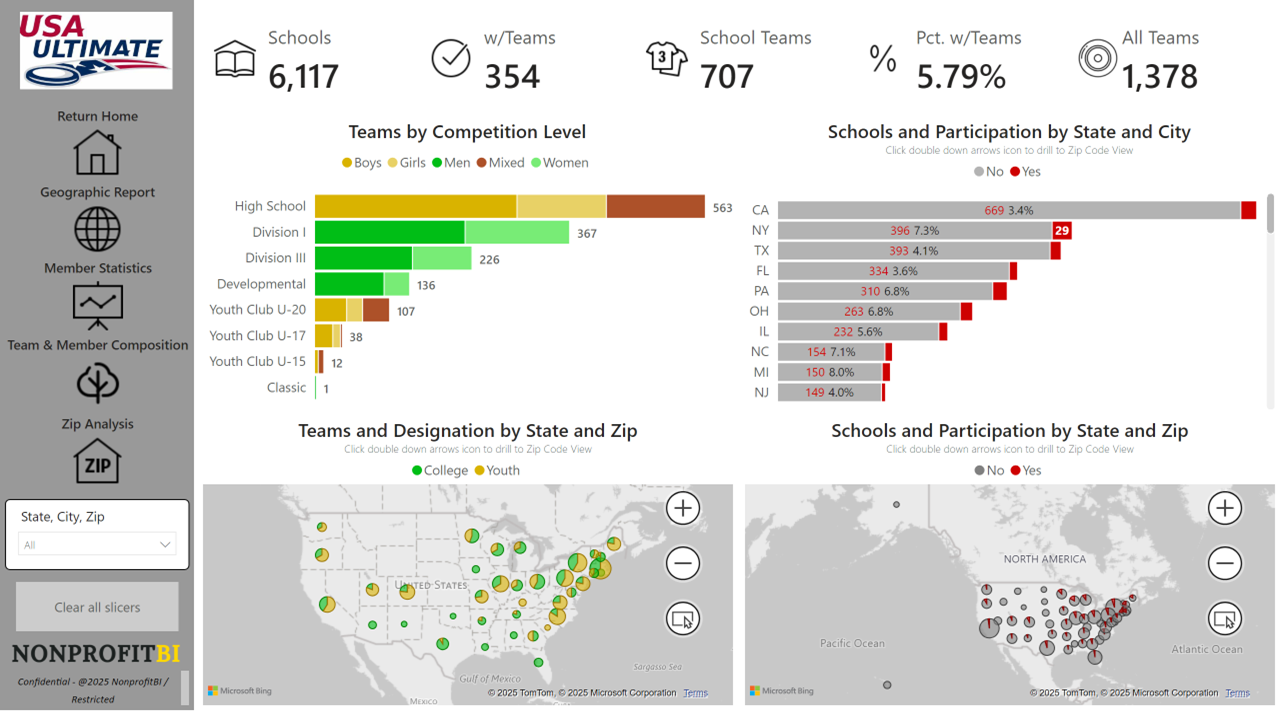
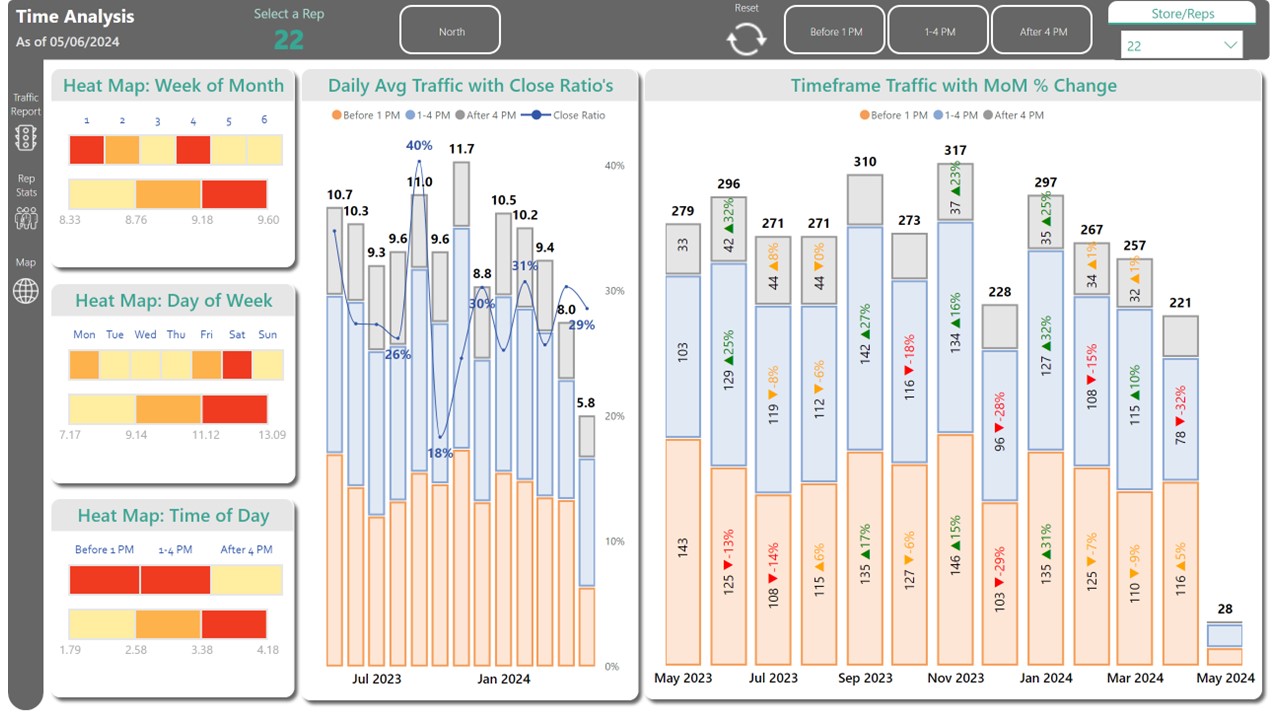
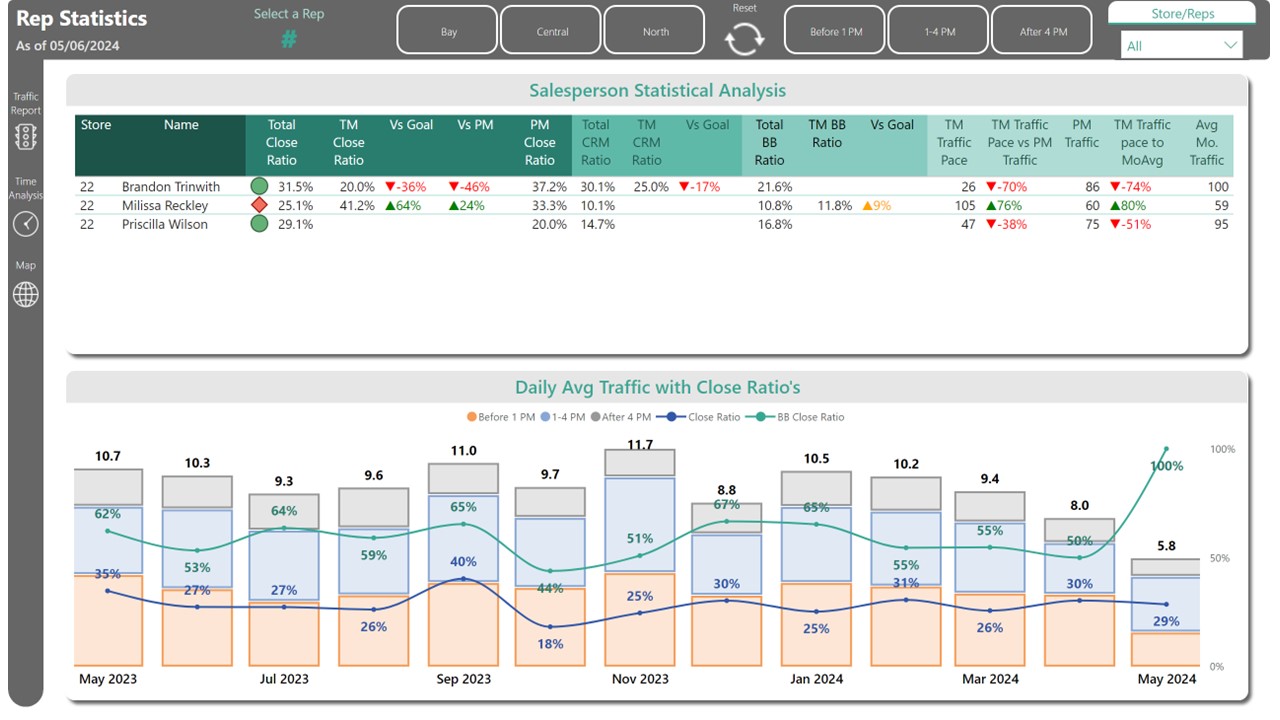
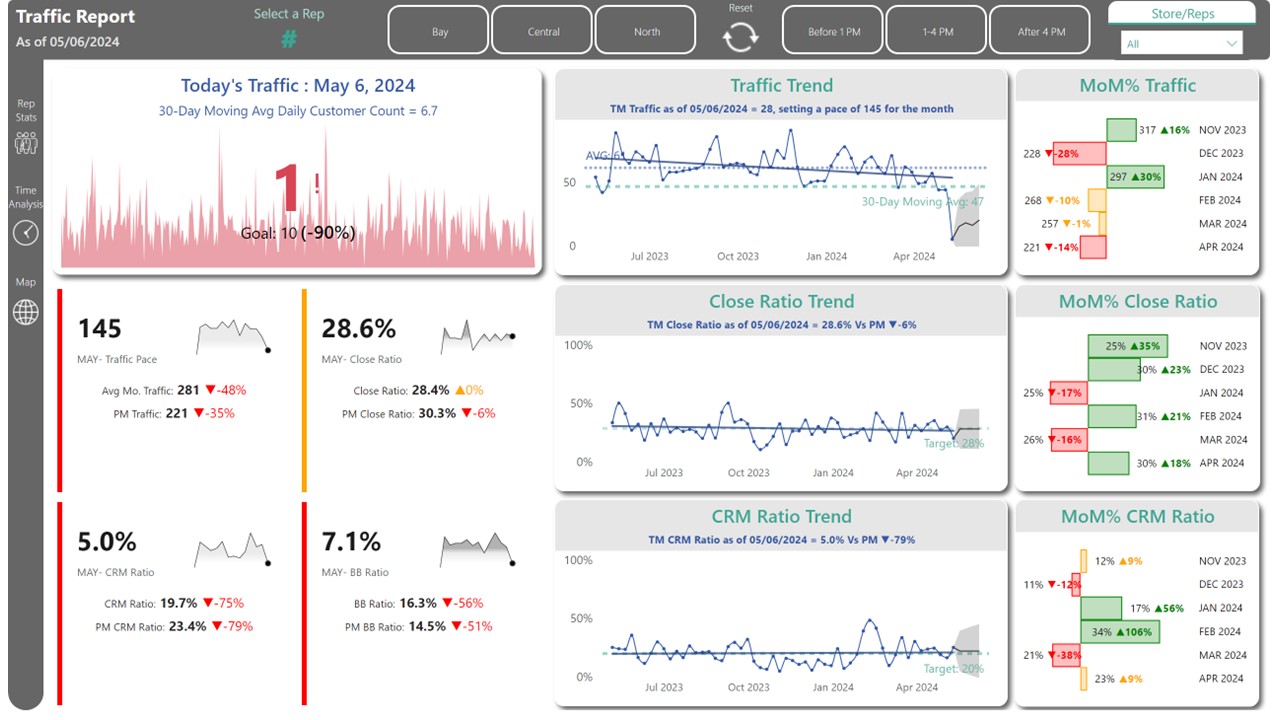
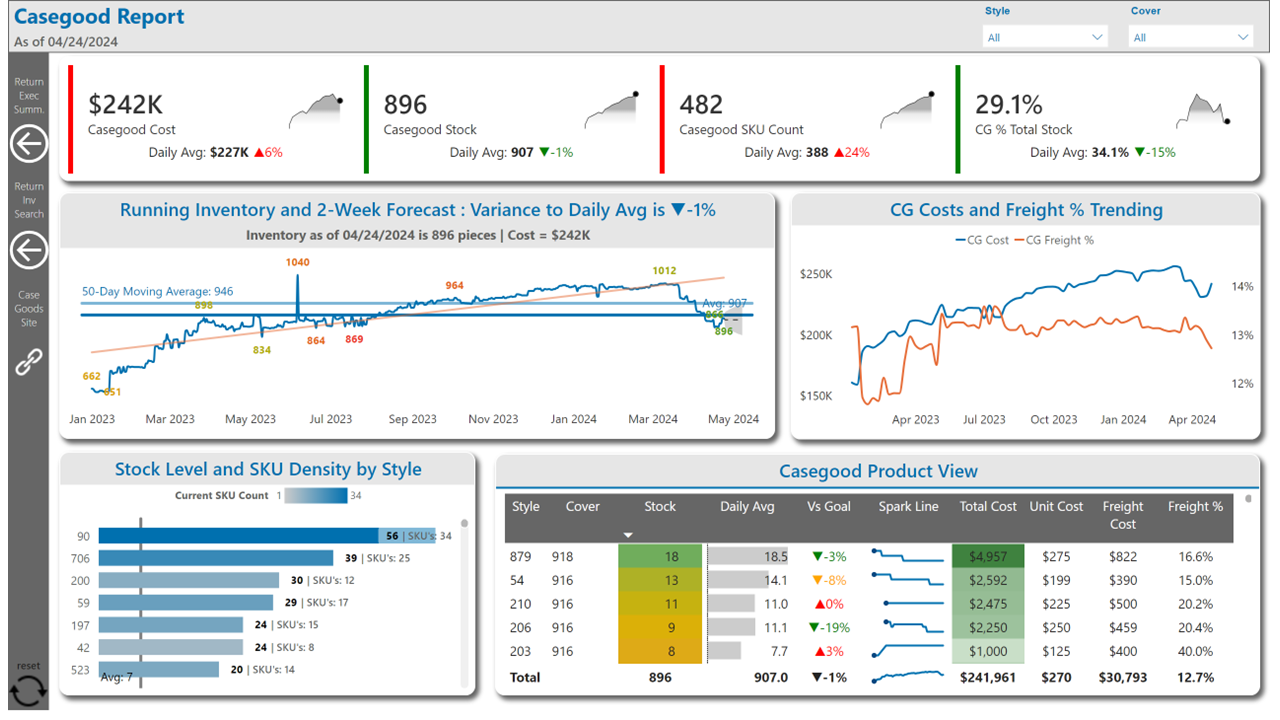
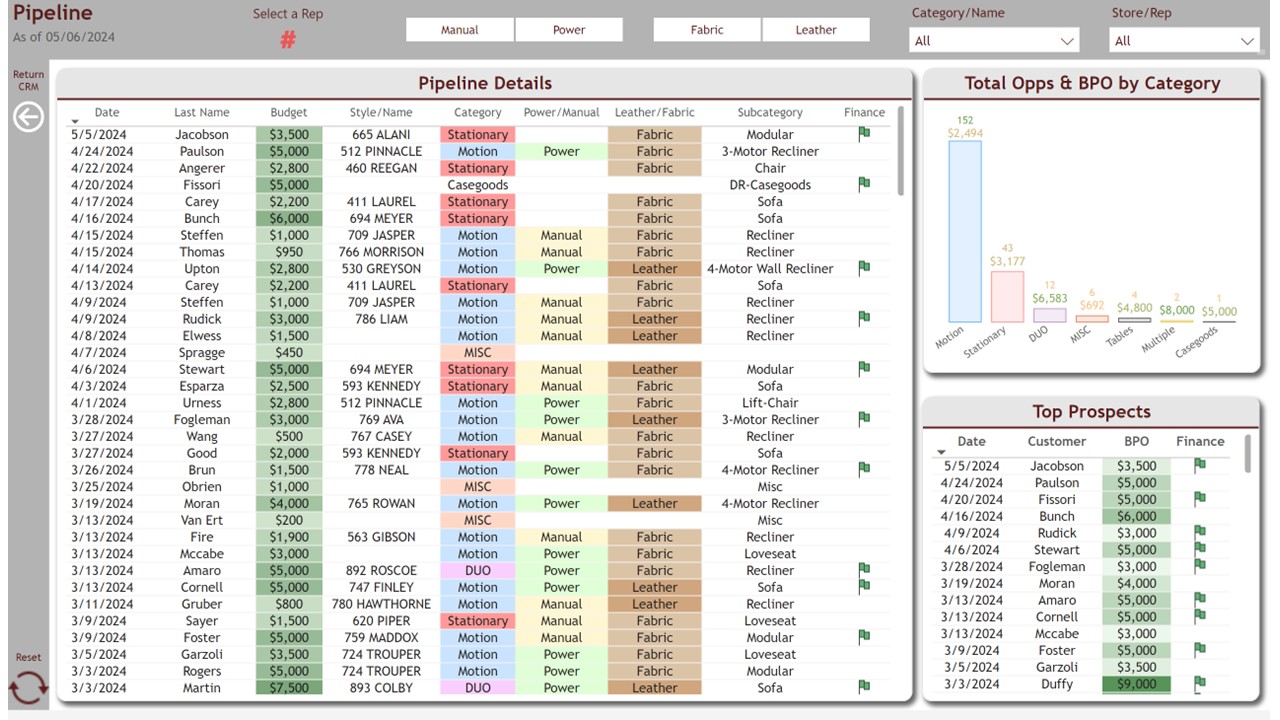
📈 Operational Dashboards – Monitor KPIs, automate workflows, and streamline reporting.
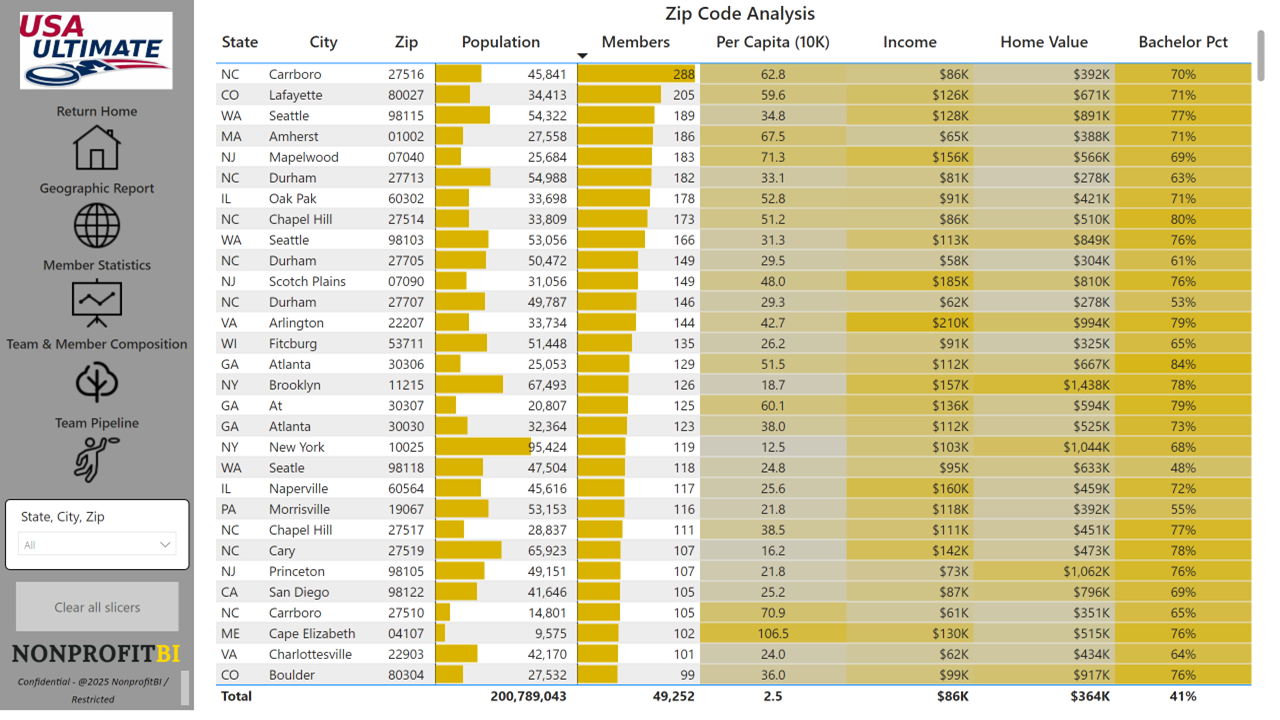
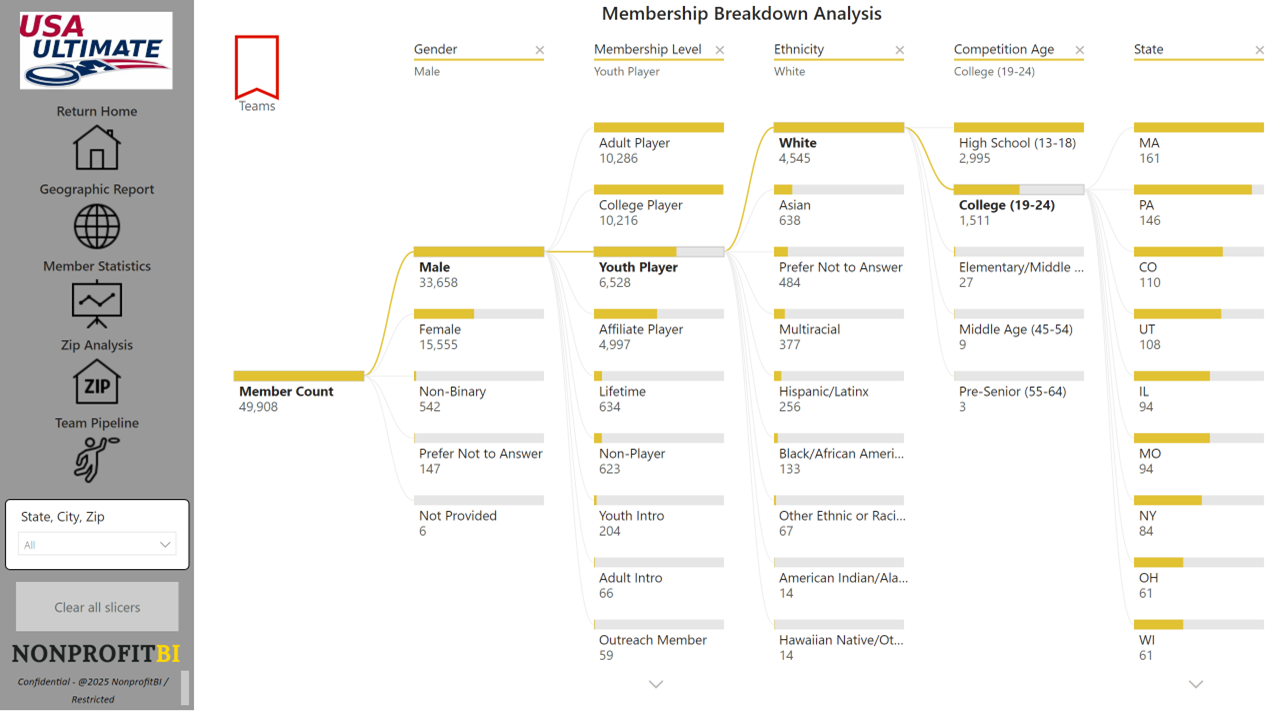
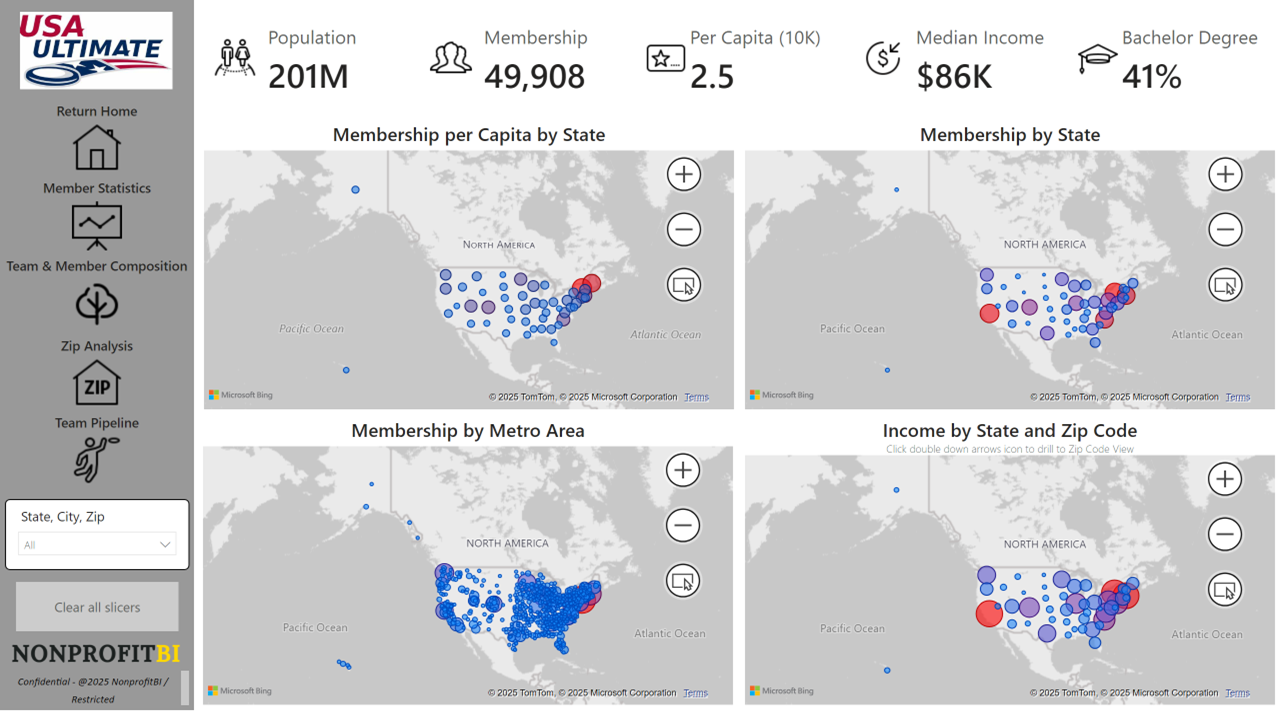
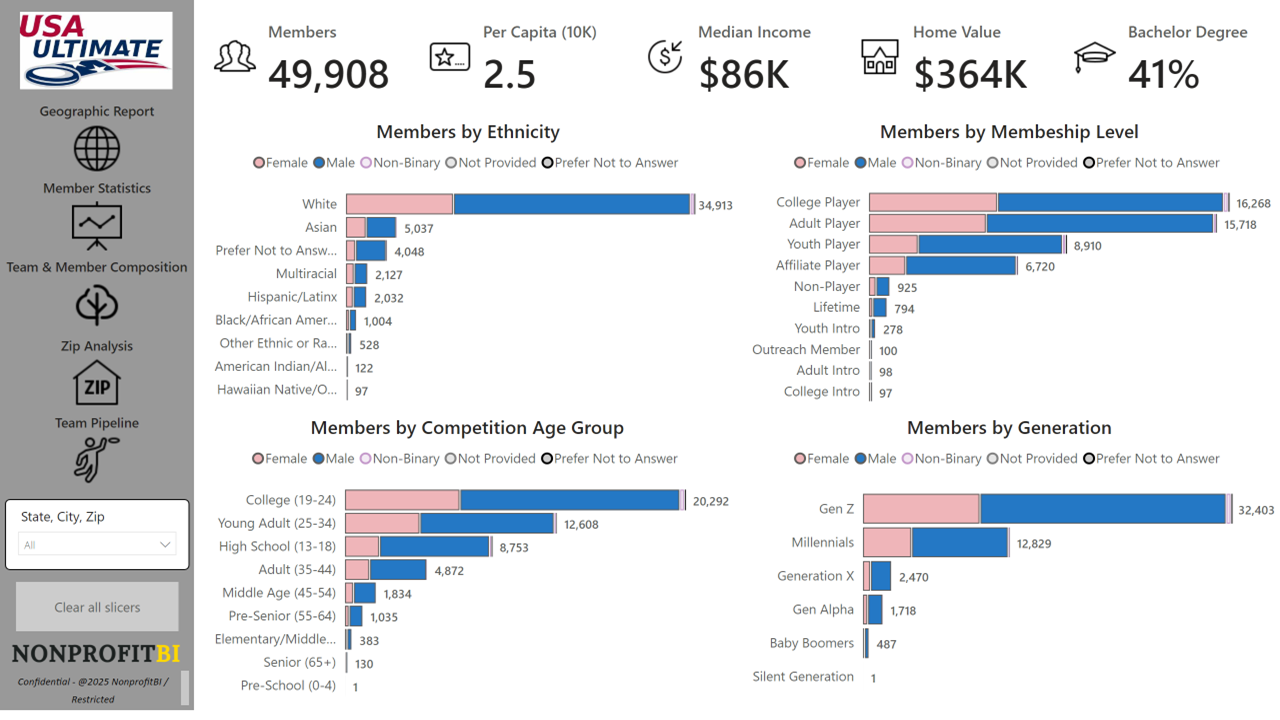
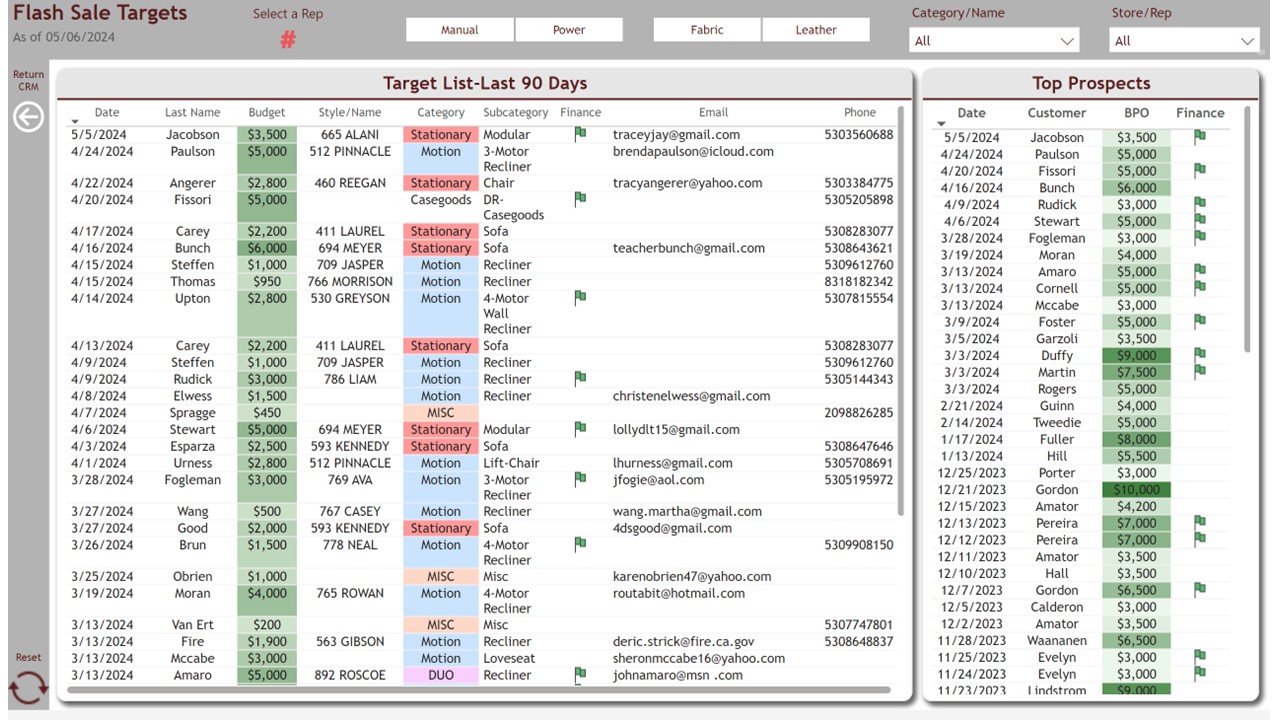
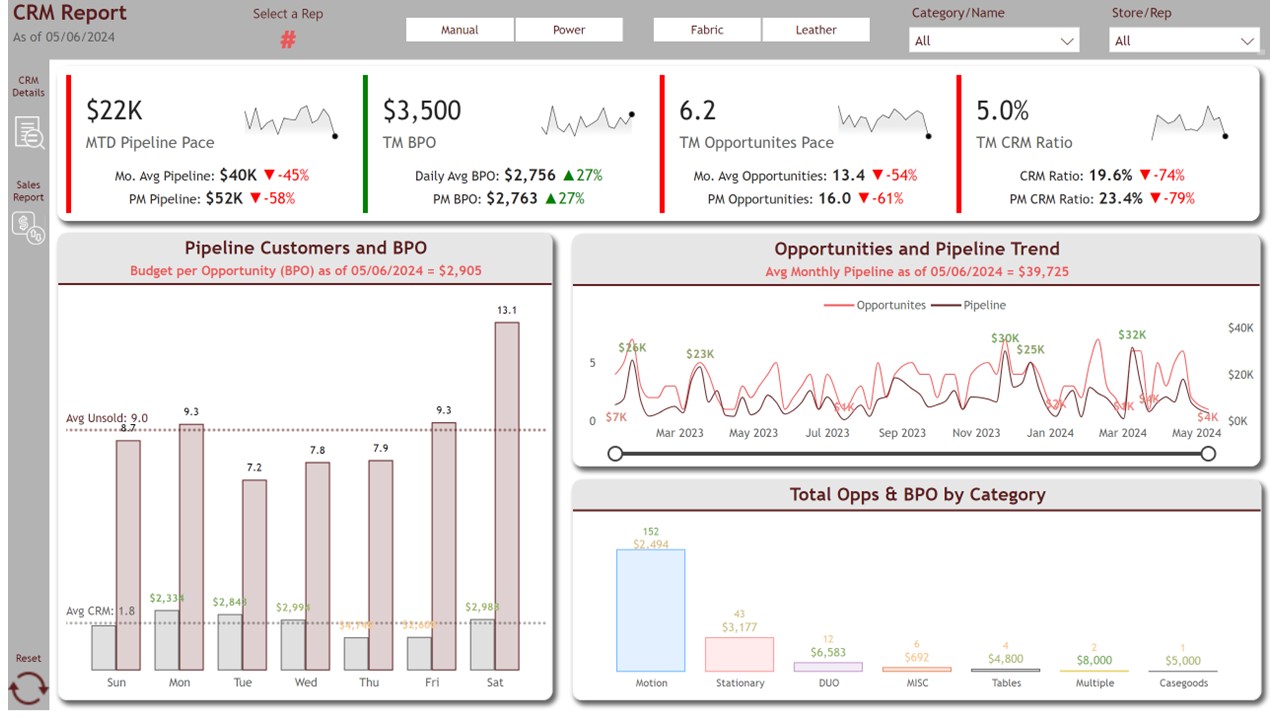
🔍 Customer & Market Insights – Visual analytics to identify trends and opportunities.
Browse through our work and see firsthand how we turn complex data into actionable insights!